
Precipitation
| Hourly | Daily | Monthly | Yearly |
0.0mm |
0.0mm |
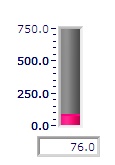
78.2mm |
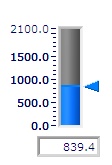
763.4mm |

Daily Precipitation (MM)
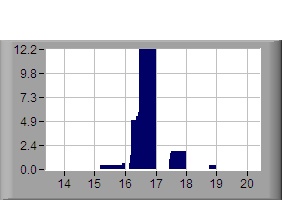
Yearly Precipitation (MM)
Precipitation since 1/1/2024
Monthly Precipitation (MM)
LAST 7 DAYS of precipitation
Historic precipitation
| mm | Jan | Feb | Mar | Apr | May | Jun | Jul | Aug | Sep | Oct | Nov | Dec |
| 2024 | ||||||||||||
| 2023 | 93.4 | 38.2 | 51.2 | 64.6 | 57.6 | 5.8 | 36.4 | 7.6 | 8.6 | 7.8 | 100.6 | 136.6 |
| 2022 | 87.2 | 634.6 | 184.2 | 44.4 | 184 | 11.4 | 74.2 | 25.8 | 53.2 | 99.2 | 47.2 | 48.0 |
| 2021 | 162.8 | 116.2 | 331.8 | 131.0 | 98.2 | 18.4 | 46.4 | 13.2 | 12.0 | 138.6 | 153.2 | 129.6 |
| 2020 | 262.8 | 457.6 | 82.6 | 15.4 | 18.0 | 30.6 | 84.2 | 32.8 | 15.4 | 143.0 | 9.4 | 188.2 |
| 2019 | 14.0 | 43.2 | 167.8 | 78.4 | 40.0 | 72.6 | 16.4 | 2.8 | 9.6 | 39.4 | 15.4 | 28.8 |
| 2018 | 9.6 | 177.6 | 111.2 | 49.2 | 36.6 | 36.6 | 23.2 | 22.0 | 44.8 | 84.6 | 31.0 | 34.2 |
| 2017 | 61.6 | 19.0 | 209.6 | 14.6 | 32.0 | 94.8 | 24.2 | 7.4 | 0.4 | 129.8 | 64.2 | 75.6 |
| 2016 | 64.2 | 39.2 | 89.8 | 36.6 | 12.8 | 129.0 | 19.6 | 28.8 | 51.6 | 34.4 | 58.2 | 95.4 |
| 2015 | 178.2 | 296.0 | 72.2 | 111.6 | 71.2 | 62.0 | 32.8 | 23.2 | 27.4 | 39.0 | 66.4 | 39.2 |
| 2014 | 101.0 | 29.4 | 88.6 | 30.8 | 51.4 | 12.8 | 10.6 | 105.8 | 34.4 | 7.8 | 15.4 | 163.8 |
| 2013 | 165.6 | 261.6 | 137.4 | 139.4 | 59.4 | 101.4 | 103.8 | 3.4 | 28.2 | 27.2 | 83.2 | 14.4 |
| 2012 | 518 | 118.4 | 138 | 123.2 | 45.8 | 141 | 56.8 | 0.0 | 13.4 | 22.0 | 83.8 | 25.2 |
| 2011 | 302.8 | 108.4 | 210.2 | 201.6 | 103.8 | 23.2 | 19.6 | 95.8 | 13.0 | 103.6 | 13.6 | 179.4 |
| 2010 | 60.2 | 188.6 | 221.4 | 129.8 | 94.2 | 24.0 | 45.2 | 117.0 | 79.4 | 259.4 | 59.4 | 433.8 |
| 2009 | 74.8 | 134 | 76 | 249.8 | 249.4 | 114.4 | 7.8 | 9.2 | 22.0 | 64.0 | 34.8 | 80.2 |
| 2008 | 113 | 151.6 | 37.6 | 38.4 | 82.2 | 62 | 100.2 | 16.6 | 64.4 | 52.6 | 325.6 | 94 |
| 2007 | 42.6 | 83.8 | 22 | 12.6 | 24.4 | 87 | 2 | 72.4 | 35.8 | 71.2 | 65 | 72.6 |